
Inception 2021: MINN
Mairs & Power
Minnesota
Municipal Bond Exchange Traded Fund (ETF)
How to Invest in MINN
To invest with the ETF, please talk with your financial advisor or select MINN through your online brokerage account.
Resources
Explore the Minnesota Municipal Bond ETF
- Performance & Price
- Fund
Facts - Objective & Strategy
- Premium / Discount
- Holdings
- Distribution History
- How to
Invest - Fund Documents
- Board of Trustees
PERFORMANCE & PRICE
Monthly Returns (%)
| As of 06/30/2026 |
Inception 3/12/2021
| FUND/INDEX | MO | YTD | 1 YR | 3 YR | SINCE INCEPTION |
| Mairs & Power Minnesota Municipal Bond ETF (NAV)1 | 0.51 | 1.50 | 6.58 | 3.51 | -0.01 |
| Mairs & Power Minnesota Municipal Bond (Market Price)1 | 0.22 | 0.77 | 6.29 | 3.51 | -0.02 |
| Bloomberg Minnesota Municipal TR Index2 | 0.75 | 1.82 | 6.44 | 3.52 | 1.02 |
Quarterly Returns (%)
| As of 06/30/2026 |
| FUND/INDEX | QTR | YTD | 1 YR | 3 YR | SINCE INCEPTION | |||||||||||||||
| Mairs & Power Minnesota Municipal Bond ETF (NAV)1 | 2.11 | 1.50 | 6.58 | 3.51 | -0.01 | |||||||||||||||
| Mairs & Power Minnesota Municipal Bond (Market Price)1 | 1.99 | 0.77 | 6.29 | 3.51 | -0.02 | |||||||||||||||
| Bloomberg Minnesota Municipal TR Index2 | 2.09 | 1.82 | 6.44 | 3.52 | 1.02 | |||||||||||||||
Calendar Year Returns (%)
| FUND/INDEX | 2025 | 2024 | 2023 | 2022 | ||||||||||||||||
| Mairs & Power Municipal Bond ETF1 | 4.80% | 0.38% | 5.26% | -12.20% | ||||||||||||||||
| Bloomberg Minnesota Municipal TR Index2 | 4.63% | 0.72% | 5.08% | -7.36% |
| ETF PRICE AS OF 07/30/2026 | |||
| Minnesota Municipal Bond ETF | MINN | ||
| NAV | Closing Market Price | Premium/ Discount %3 | 30 Day Median Spread %4 |
| $21.92 | $21.93 | 0.03 | 0.45 |
| Expense ratio annualized per the current Prospectus | ||||||||||||||||||||
| 0.25% | ||||||||||||||||||||
Returns are average annualized total returns, except those for periods of less than one year, which are cumulative.
Performance quoted represents past performance, which is no guarantee of future results. Investment return and principal value will fluctuate, so you may have a gain or loss when shares are sold. Current performance may be higher or lower than that quoted.
1Performance shown includes the reinvestment of dividend and capital gain distributions, but does not reflect the deduction of taxes that a shareholder would pay on Fund distributions or the redemption of Fund shares.
Index Definitions
2Bloomberg Minnesota Municipal TR Index is a market capitalization - weighted index of Minnesota Investment-grade bonds with maturities of one year or more.
3Premium/Discount If the price of the ETF is trading above its NAV, the ETF is said to be trading at a “premium.” Conversely, if the price of the ETF is trading below its NAV, the ETF is said to be trading at a “discount.” In relatively calm markets, ETF prices and NAV generally stay close.
430 Day Median Spread % a calculation of Fund’s median bid-ask spread, expressed as a percentage rounded to the nearest hundredth, computed by: identifying the Fund’s national best bid and national best offer as of the end of each 10 second interval during each trading day of the last 30 calendar days; dividing the difference between each such bid and offer by the midpoint of the national best bid and national best offer; and identifying the median of those values.
It is not possible to invest directly in an index.
FUND FACTS
| As of 6/30/2026: | ||||||||||||||||||||
| Ticker | MINN | |||||||||||||||||||
| Fund Type | Active | |||||||||||||||||||
| Primary Exchange5 | Cboe | |||||||||||||||||||
| Inception Date | 3/12/2021 | |||||||||||||||||||
| Style | Fixed Inc./Muni | |||||||||||||||||||
| Expense Ratio | 0.25% | |||||||||||||||||||
| NAV / Price6 | $22.39 |
| Premium / Discount3 | 0.00% |
| Holdings | 126 |
| 30-Day SEC Yield7 | 3.15% |
| Wtd. Average Maturity8 | 10.6 |
| Net Yield to Worst at NAV9 | 3.08% |
| Duration to Worst10 | 5.51 |
| Sales Charge11 | None |
| Income Distributions | Monthly |
| Capital Gains | Annual |
OBJECTIVE & STRATEGY
Seeks current income that is exempt from federal and Minnesota state income tax consistent with the preservation of capital.
HOLDINGS
CREDIT QUALITY*
as of 6/30/2026
| AAA and Higher | 34.3% | |
| AA | 49.5% | |
| A | 10.9% | |
| BBB and Lower | 2.8% | |
| Unrated | 0.9% |
MATURITY
as of 6/30/2026
| 0-5 years | 17.9% | |
| 6-10 years | 20.3% | |
| 11-20 years | 60.2% | |
| Greater than 20 years | 0.0% |
| SECTORS AS OF 6/30/2026 | % PORTFOLIO | |
| Local | 60.2 | |
| State | 10.6 | |
| Health Care | 8.1 | |
| Education | 6.3 | |
| Lease | 6.3 | |
| Housing | 2.7 | |
| Utilities | 1.5 | |
| Transportation | 1.5 | |
| Other | 1.2 | |
| - | ||
| - | ||
| Total | 98.4 |
| FULL PORTFOLIO AS OF 07/31/2026 | CUSIP | SHARES | $ MARKET VALUE | % PORTFOLIO |
|---|---|---|---|---|
| Stillwater Independent School District No 834 5% 02/01/2035 | 860758TP6 | 1,075,000 | 1,197,186 | 2.54% |
| State of Minnesota 5% 08/01/2037 | 60412AW33 | 1,000,000 | 1,114,489 | 2.36% |
| University of Minnesota 5% 04/01/2039 | 914460YS3 | 1,000,000 | 1,100,821 | 2.34% |
| State of Minnesota 5% 08/01/2039 | 60412AM83 | 1,000,000 | 1,089,400 | 2.31% |
| Metropolitan Council 5% 03/01/2043 | 5918527Q5 | 1,000,000 | 1,084,686 | 2.30% |
| South Washington County Independent School District No 833/MN 5% 02/01/2037 | 840610VA4 | 1,000,000 | 1,069,569 | 2.27% |
| State of Minnesota 5% 08/01/2027 | 60412A2V4 | 1,000,000 | 1,024,267 | 2.17% |
| Mankato Independent School District No 77 4% 02/01/2042 | 563690TZ9 | 1,000,000 | 995,724 | 2.11% |
| Minnesota Housing Finance Agency 4.35% 07/01/2041 | 60416UW43 | 1,000,000 | 988,529 | 2.10% |
| New London-Spicer Independent School District No 345 5% 02/01/2033 | 646666PS0 | 895,000 | 983,584 | 2.09% |
| Madelia Independent School District No 837 4% 02/01/2045 | 556411ED4 | 1,000,000 | 970,311 | 2.06% |
| City of Rochester MN 4% 11/15/2043 | 771902HZ9 | 1,000,000 | 964,203 | 2.05% |
| City of New Prague MN 4.125% 12/01/2044 | 648165CP1 | 955,000 | 919,199 | 1.95% |
| West St Paul-Mendota Heights-Eagan Independent School District No 197 3.65% 02/01/2038 | 955686TF7 | 1,000,000 | 920,291 | 1.95% |
| St Paul Independent School District No 625 4.125% 02/01/2045 | 792897UA6 | 835,000 | 814,086 | 1.73% |
| City of Bloomington MN 4% 02/01/2042 | 094781BK6 | 815,000 | 803,657 | 1.70% |
| North Mankato Port Authority 5% 02/01/2039 | 660760EA3 | 750,000 | 795,673 | 1.69% |
| County of Ramsey MN 3% 02/01/2028 | 751622RB9 | 700,000 | 700,040 | 1.49% |
| City of Bloomington MN 4% 02/01/2040 | 0947808G1 | 655,000 | 659,219 | 1.40% |
| St Michael-Albertville Independent School District No 885 5% 02/01/2040 | 792775RH3 | 540,000 | 588,322 | 1.25% |
| Minneapolis Special School District No 1 5% 02/01/2028 | 603792VM1 | 565,000 | 583,950 | 1.24% |
| Inver Grove Heights Independent School District No 199 5% 02/01/2032 | 461225GD0 | 500,000 | 548,555 | 1.16% |
| State of Minnesota 5% 08/01/2029 | 60412AD26 | 510,000 | 543,507 | 1.15% |
| State of Minnesota Department of Iron Range Resources & Rehabilitation 5% 10/01/2031 | 60414HBA3 | 500,000 | 542,568 | 1.15% |
| North Mankato Port Authority 5% 02/01/2036 | 660760DX4 | 500,000 | 540,086 | 1.15% |
| County of Hennepin MN 5% 12/01/2044 | 425507QF0 | 500,000 | 536,499 | 1.14% |
| Osseo Independent School District No 279 5% 02/01/2027 | 6884432P4 | 530,000 | 535,817 | 1.14% |
| Minnesota Agricultural & Economic Development Board 5% 01/01/2039 | 6049202W7 | 500,000 | 527,783 | 1.12% |
| Minnesota Housing Finance Agency 4.85% 07/01/2045 | 60416UWR2 | 500,000 | 505,231 | 1.07% |
| County of Ramsey MN 5% 02/01/2027 | 751622A35 | 500,000 | 505,737 | 1.07% |
| Forest Lake Independent School District No 831 4% 02/01/2039 | 345874VT5 | 500,000 | 501,708 | 1.06% |
| Fairmont Independent School District No 2752 4% 02/01/2040 | 305229HW9 | 500,000 | 486,247 | 1.03% |
| State of Minnesota 5% 08/01/2043 | 60412AH55 | 400,000 | 425,451 | 0.90% |
| City of Northfield MN 5% 02/01/2041 | 666179GW0 | 385,000 | 407,957 | 0.87% |
| City of Center City MN 5% 11/01/2038 | 151452CN7 | 370,000 | 395,529 | 0.84% |
| Big Lake Economic Development Authority 5% 02/01/2046 | 089267AU2 | 370,000 | 380,348 | 0.81% |
| Redwood Area Schools Independent School District No 2897 4% 02/01/2039 | 757763DL8 | 360,000 | 361,735 | 0.77% |
| Alden-Conger Independent School District No 242 3% 02/01/2027 | 014083CK3 | 330,000 | 329,865 | 0.70% |
| County of Ramsey MN 5% 02/01/2038 | 751622ZT1 | 300,000 | 328,449 | 0.70% |
| Anoka-Hennepin Independent School District No 11 4% 02/01/2032 | 0363034E2 | 320,000 | 324,881 | 0.69% |
| County of Koochiching MN 5% 02/01/2035 | 500494FQ7 | 300,000 | 324,939 | 0.69% |
| City of Marshall MN Public Utility Revenue 5% 07/01/2038 | 572565JD2 | 300,000 | 326,222 | 0.69% |
| City of New Prague MN 4% 02/01/2037 | 648159F63 | 315,000 | 319,057 | 0.68% |
| Minneapolis Special School District No 1 5% 02/01/2042 | 603790YD2 | 295,000 | 312,129 | 0.66% |
| International Falls Independent School District No 361 4% 02/01/2041 | 459488GD8 | 300,000 | 297,367 | 0.63% |
| City of Hermantown MN 4% 02/01/2043 | 427500VU4 | 300,000 | 293,864 | 0.62% |
| State of Minnesota 5% 08/01/2028 | 60412ARQ8 | 280,000 | 293,239 | 0.62% |
| Rosemount-Apple Valley-Eagan Independent School District No 196 4% 02/01/2043 | 777594ZX3 | 300,000 | 287,636 | 0.61% |
| Truman Independent School District No 458 4% 02/01/2044 | 898014DF9 | 300,000 | 287,927 | 0.61% |
| County of Renville MN 5% 02/01/2029 | 760184GX3 | 270,000 | 284,430 | 0.60% |
| Robbinsdale Independent School District No 281 5% 02/01/2034 | 770265LD6 | 250,000 | 276,654 | 0.59% |
| City of St Cloud MN 5% 05/01/2036 | 78916VFG0 | 250,000 | 276,385 | 0.59% |
| City of Albert Lea MN 5% 02/01/2038 | 012788K20 | 250,000 | 271,223 | 0.58% |
| Cedar Mountain Independent School District No 2754 5% 02/01/2036 | 150452DV9 | 250,000 | 272,799 | 0.58% |
| City of Maple Lake MN 5% 02/01/2036 | 565250RM1 | 260,000 | 271,234 | 0.58% |
| St Paul Housing & Redevelopment Authority Parking Enterprise Revenue 5% 12/01/2034 | 79289WBL8 | 250,000 | 271,112 | 0.58% |
| Minnesota Health & Education Facilities Authority 5% 10/01/2034 | 60416JBY5 | 260,000 | 270,852 | 0.57% |
| Minnesota Health & Education Facilities Authority 5% 10/01/2029 | 60416JEV8 | 255,000 | 269,253 | 0.57% |
| City of Rosemount MN 5% 02/01/2037 | 7775773L9 | 250,000 | 267,779 | 0.57% |
| City of Apple Valley MN 4% 09/01/2041 | 03800RBE5 | 290,000 | 265,717 | 0.56% |
| County of Carlton MN 5% 02/01/2042 | 142879MT9 | 250,000 | 264,223 | 0.56% |
| Crookston Independent School District No 593 5% 02/01/2029 | 227237PS7 | 250,000 | 262,959 | 0.56% |
| Minneapolis-St Paul Metropolitan Airports Commission 5% 01/01/2032 | 603827B54 | 250,000 | 263,927 | 0.56% |
| Stillwater Independent School District No 834 5% 02/01/2040 | 860758TA9 | 250,000 | 265,016 | 0.56% |
| County of Hennepin MN 5% 12/15/2037 | 425507HS2 | 250,000 | 259,660 | 0.55% |
| State of Minnesota 5% 08/01/2034 | 60412APJ6 | 250,000 | 258,780 | 0.55% |
| Minnesota Agricultural & Economic Development Board 5% 01/01/2042 | 6049202Z0 | 250,000 | 259,417 | 0.55% |
| City of St Cloud MN 5% 05/01/2043 | 78916VER7 | 250,000 | 260,967 | 0.55% |
| Eastern Carver County Schools Independent School District No 112 4% 02/01/2035 | 161681UU3 | 250,000 | 254,137 | 0.54% |
| City of Grand Rapids MN 4% 02/01/2038 | 386335HF3 | 250,000 | 255,799 | 0.54% |
| County of Hubbard MN 4% 02/01/2036 | 443348ET0 | 250,000 | 256,387 | 0.54% |
| Zumbro Education District 4% 02/01/2038 | 989781BA6 | 275,000 | 256,106 | 0.54% |
| City of Duluth MN 5% 02/01/2030 | 264438X72 | 250,000 | 250,473 | 0.53% |
| Elk River Independent School District No 728 4% 02/01/2037 | 287425T28 | 250,000 | 252,071 | 0.53% |
| State of Minnesota 5% 08/01/2026 | 60412AQS5 | 250,000 | 250,000 | 0.53% |
| City of Victoria MN 4% 02/01/2042 | 926278XH0 | 250,000 | 247,651 | 0.53% |
| County of Beltrami MN 4% 12/01/2042 | 081131HC1 | 250,000 | 245,278 | 0.52% |
| City of Minneapolis MN 4% 11/15/2037 | 60374VES8 | 250,000 | 244,283 | 0.52% |
| Minnesota Health & Education Facilities Authority 3% 10/01/2041 | 60416JCZ1 | 300,000 | 243,995 | 0.52% |
| Housing & Redevelopment Authority of The City of St Paul Minnesota 4% 10/01/2037 | 85236DBJ6 | 250,000 | 245,932 | 0.52% |
| State of Minnesota Department of Iron Range Resources & Rehabilitation 5% 10/01/2035 | 20261DCE1 | 220,000 | 241,926 | 0.51% |
| Waterville-Elysian-Morristown Independent School District No 2143/MN 4% 02/01/2045 | 94222RBY0 | 250,000 | 241,020 | 0.51% |
| City of Cambridge MN 5% 02/01/2035 | 132339N32 | 215,000 | 236,883 | 0.50% |
| St Cloud Independent School District No 742/MN 5% 02/01/2041 | 789177SP8 | 225,000 | 234,222 | 0.50% |
| Cloquet Area Fire & Ambulance Special Taxing District 5% 02/01/2035 | 189019AJ1 | 200,000 | 221,300 | 0.47% |
| University of Minnesota 5% 10/01/2026 | 914460TB6 | 220,000 | 220,853 | 0.47% |
| South Washington County Independent School District No 833/MN 5% 04/01/2031 | 840611DL8 | 200,000 | 217,062 | 0.46% |
| Minnesota Agricultural & Economic Development Board 5% 11/15/2044 | 60389WAS3 | 205,000 | 211,718 | 0.45% |
| Minnesota Health & Education Facilities Authority 4% 03/01/2036 | 60416H3N2 | 215,000 | 212,145 | 0.45% |
| City of Montgomery MN 5% 02/01/2030 | 613851PC2 | 200,000 | 213,355 | 0.45% |
| St Paul Independent School District No 625 5% 02/01/2042 | 792897SK7 | 200,000 | 213,284 | 0.45% |
| County of Hennepin MN 5% 12/01/2030 | 425507GN4 | 195,000 | 200,447 | 0.43% |
| Rochester Independent School District No 535 4% 02/01/2031 | 771614SZ8 | 200,000 | 202,747 | 0.43% |
| Minnesota State Colleges And Universities Foundation 4% 10/01/2029 | 60414FMU1 | 200,000 | 200,117 | 0.42% |
| County of Itasca MN 4% 02/01/2044 | 465452NN6 | 200,000 | 192,070 | 0.41% |
| City of Northfield MN 4% 02/01/2044 | 666179GZ3 | 200,000 | 193,382 | 0.41% |
| City of Owatonna MN 4% 03/01/2035 | 690530ZW3 | 175,000 | 180,526 | 0.38% |
| Pine City Independent School District No 578 2% 04/01/2032 | 722514AL0 | 200,000 | 177,098 | 0.38% |
| Duluth Independent School District No 709 0% 02/01/2031 | 264471LL5 | 200,000 | 168,010 | 0.36% |
| County of Hennepin MN 5% 12/01/2042 | 425507QD5 | 155,000 | 167,671 | 0.36% |
| State of Minnesota 4% 09/01/2034 | 60412AWP4 | 165,000 | 168,539 | 0.36% |
| City of Apple Valley MN 4% 09/01/2030 | 03800RBB1 | 160,000 | 160,605 | 0.34% |
| County of Hennepin MN 5% 12/01/2043 | 425507PL8 | 150,000 | 160,588 | 0.34% |
| St Louis Park Independent School District No 283 5% 04/01/2032 | 791759AG8 | 150,000 | 162,061 | 0.34% |
| Waconia Independent School District No 110 5% 02/01/2038 | 930047QU2 | 150,000 | 159,449 | 0.34% |
| Metropolitan Council 4% 03/01/2030 | 591852F29 | 155,000 | 155,991 | 0.33% |
| Alexandria Lake Area Sanitation District 4% 02/01/2036 | 015091DF5 | 150,000 | 150,655 | 0.32% |
| City of Minneapolis MN 5% 11/15/2036 | 60374VEB5 | 150,000 | 152,703 | 0.32% |
| Minneapolis-St Paul Metropolitan Airports Commission 5% 01/01/2031 | 603827WW2 | 150,000 | 151,287 | 0.32% |
| Minnesota Housing Finance Agency 3.1% 02/01/2027 | 60416URC1 | 150,000 | 150,017 | 0.32% |
| Owatonna Independent School District No 761/MN 4% 02/01/2028 | 690564RK7 | 150,000 | 152,730 | 0.32% |
| Dakota County Community Development Agency 4.2% 05/01/2043 | 23409VFP0 | 150,000 | 139,562 | 0.30% |
| City of Jordan MN 4% 02/01/2033 | 480700R96 | 135,000 | 139,642 | 0.30% |
| City of Center City MN 4% 11/01/2027 | 151452BW8 | 135,000 | 136,543 | 0.29% |
| City of Minneapolis MN 5% 11/15/2052 | 60374VEW9 | 130,000 | 135,350 | 0.29% |
| Stillwater Independent School District No 834 4% 02/01/2041 | 860758TB7 | 130,000 | 129,705 | 0.28% |
| St Cloud Independent School District No 742/MN 0% 02/01/2033 | 789177SZ6 | 150,000 | 117,774 | 0.25% |
| Princeton Public Utilities Commission 5% 04/01/2031 | 742271BG3 | 100,000 | 106,320 | 0.23% |
| Metropolitan Council 5% 12/01/2028 | 591852Z76 | 100,000 | 105,253 | 0.22% |
| Minnesota Health & Education Facilities Authority 3% 03/01/2043 | 60416JDW7 | 125,000 | 101,480 | 0.22% |
| Housing & Redevelopment Authority of The City of St Paul Minnesota 3.125% 11/15/2032 | 792909FE8 | 110,000 | 102,436 | 0.22% |
| Waconia Independent School District No 110 3% 02/01/2028 | 930047LZ6 | 100,000 | 99,908 | 0.21% |
| Westonka Independent School District No 277 4% 02/01/2041 | 960906GD1 | 100,000 | 98,907 | 0.21% |
| St Paul Independent School District No 625 2.25% 02/01/2035 | 792897NY2 | 100,000 | 85,808 | 0.18% |
| Housing & Redevelopment Authority of The City of St Paul Minnesota 3.5% 09/01/2026 | 852297BV1 | 35,000 | 34,974 | 0.07% |
| Cash & Other | Cash&Other | 804,397 | 804,397 | 1.71% |
Full holdings
DISTRIBUTION HISTORY
The Mairs & Power Minnesota Municipal Bond ETF declares and pays dividend income monthly. If any capital gains are realized during the year, the Fund will distribute the net gains in December toward the end of the month.
| DECLARATION | EX-DATE | RECORD DATE | PAYMENT DATE | AMOUNT | DISTRIBUTION TYPE |
| 1/22/2026 | 1/23/2026 | 1/23/2026 | 1/30/2026 | $0.03928 | Ordinary Dividends |
| 2/19/2026 | 2/20/2026 | 2/20/2026 | 2/27/2026 | $0.04886 | Ordinary Dividends |
| 3/25/2026 | 3/26/2026 | 3/26/2026 | 3/31/2026 | $0.06839 | Ordinary Dividends |
| 4/23/2026 | 4/24/2026 | 4/24/2026 | 4/30/2026 | $0.05288 | Ordinary Dividends |
| 5/21/2026 | 5/22/2026 | 5/22/2026 | 5/29/2026 | $0.05394 | Ordinary Dividends |
| 6/24/2026 | 6/25/2026 | 6/25/2026 | 6/30/2026 | $0.06397 | Ordinary Dividends |
| 7/23/2026 | 7/24/2026 | 7/24/2026 | 7/31/2026 | $0.05602 | Ordinary Dividends |
| 8/25/2026 | 8/26/2026 | 8/26/2026 | 8/31/2026 | - | Ordinary Dividends |
| 9/24/2026 | 9/25/2026 | 9/25/2026 | 9/30/2026 | - | Ordinary Dividends |
| 10/22/2026 | 10/23/2026 | 10/23/2026 | 10/30/2026 | - | Ordinary Dividends |
| 11/23/2026 | 11/24/2026 | 11/24/2026 | 11/30/2026 | - | Ordinary Dividends |
| 12/17/2026 | 12/18/2026 | 12/18/2026 | 12/29/2026 | - | Ordinary Dividends |
How to Invest
Shares of the Mairs & Power Minnesota Municipal Bond ETF can be purchased through your financial advisor or are available through online brokerage firms. These firms may charge commissions and sales charges.
QUESTIONS?
We’re here to help you with all your account servicing questions.
Please call 855-839-2800
FUND DOCUMENTS
RESOURCES
REPORTS
BOARD LEADERSHIP STRUCTURE
The Board has structured itself in a manner that it believes allows it to effectively perform its oversight function.
The Board of Trustees is composed of six Independent Trustees and one Trustee who is an “interested person” of the Trust (the “Interested Trustee”).
Dr. Michael D. Akers
Mr. Gary A. Drska
Vincent P. Lyles
Erik K. Olstein
Lisa Zúñiga Ramírez
Gregory M. Wesley
Accordingly, 85% of the members of the Board are Independent Trustees, Trustees who are not affiliated with the Adviser or its affiliates, or any other investment adviser or other service provider to the Trust or any underlying fund. The Board of Trustees has established three standing committees, an Audit Committee, a Nominating Committee and a Valuation Committee. Each of the Audit Committee and the Nominating Committee is comprised entirely of Independent Trustees. The Independent Trustees have engaged their own independent counsel to advise them on matters relating to their responsibilities in connection with the Trust. More information is available in the Statement of Additional Information (SAI).
IMPORTANT RISKS
Investments involve risk. The Fund is designed for long-term investors. Principal loss is possible.
Mairs & Power Minnesota Municipal Bond ETF has the same risks as the underlying securities traded on the exchange throughout the day. Redemptions are limited and often commissions are charged on every trade.
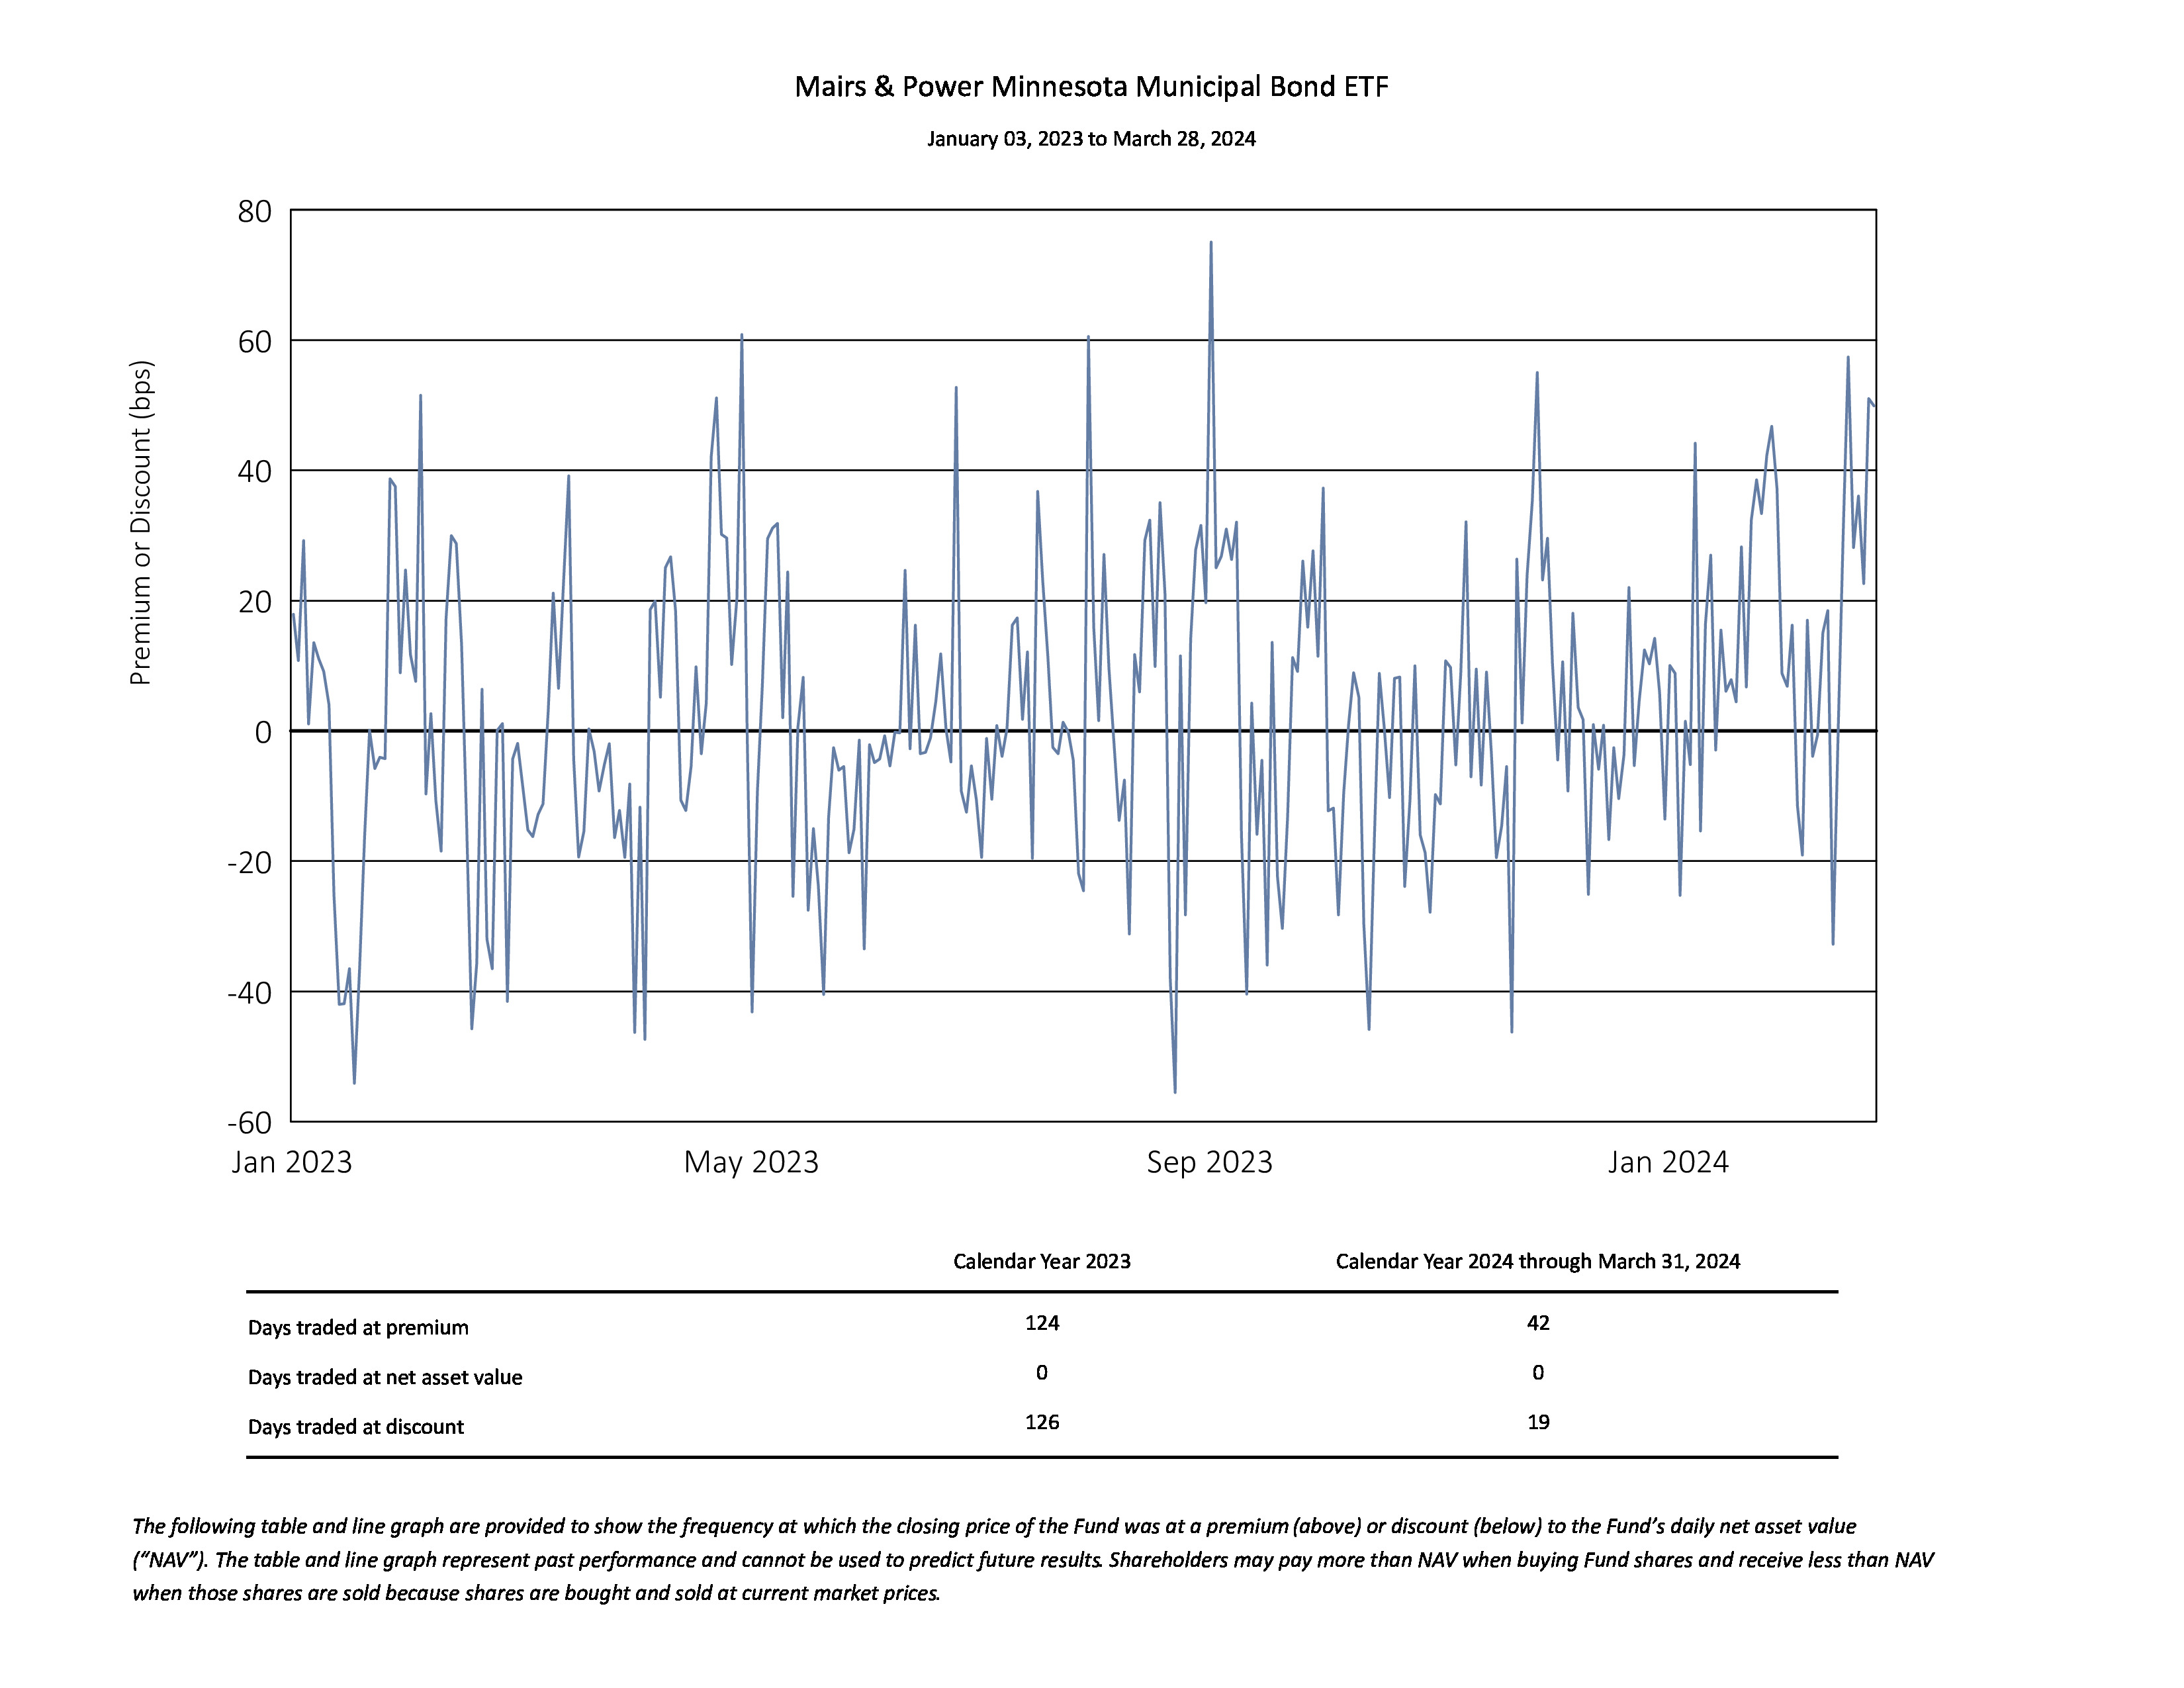
The Fund may trade at a premium or discount to NAV. Shareholders may pay more than NAV when they buy Fund shares and receive less than NAV when they sell those shares, because shares are bought and sold at current market prices. The data presented represents past performance and cannot be used to predict future results.
Investments in debt securities typically decrease in value when interest rates rise. This risk is usually greater for longer-term debt securities. Investment by the Fund in lower-rated and non-rated securities presents a greater risk of loss to principal and interest than higher-rated securities. Because the Fund invests substantially in Minnesota municipal instruments, it is more exposed to the impact of negative political, economic and legislative factors within Minnesota than a fund that invests more widely. The Fund is also subject to risks associated with investments in the municipal bond market, municipal mortgage backed securities, and other investment companies. The Fund is a recently organized management investment company with no operating history. As a result, prospective investors have a limited track record on which to base their investment decision. There is also a risk that the Fund will not grow to or maintain an economically viable size, in which case it could ultimately liquidate without shareholder approval.
Some of the Fund investments may be subject to AMT. Although the Fund is exempt from federal tax, you may owe taxes on any capital gains realized through the fund's trading or through your own redemption of shares.For some investors, a portion of the fund's income may be subject to state and local taxes.
Monthly income distributions are not guaranteed.
*Mairs & Power uses lower of the S&P or Moody's ratings and chooses to display credit ratings using S&P’s rating convention, although the rating itself might be sourced from another Nationally Recognized Statistical Rating Agency. The ratings apply to the credit worthiness of the issuers of the underlying securities and not to the fund itself. Ratings are expressed as letters ranging from ‘AAA’, which is the highest grade, to ‘D’, which is the lowest grade. In limited situations when the rating agency has not issued a formal rating, the rating agency will classify the security as unrated.
3Premium/Discount If the price of the ETF is trading above its NAV, the ETF is said to be trading at a "premium." Conversely, if the price of the ETF is trading below its NAV, the ETF is said to be trading at a "discount." In relatively calm markets, ETF prices and NAV generally stay close.
430 Day Median Spread % a calculation of Fund’s median bid-ask spread, expressed as a percentage rounded to the nearest hundredth, computed by: identifying the Fund’s national best bid and national best offer as of the end of each 10 second interval during each trading day of the last 30 calendar days; dividing the difference between each such bid and offer by the midpoint of the national best bid and national best offer; and identifying the median of those values.
5Cboe Global Markets
6NAV/Price The ETF market price is the price at which shares in the ETF can be bought or sold on the exchanges during trading hours. The net asset value (NAV) of an ETF represents the value of each share's portion of the fund's underlying assets and cash at the end of the trading day.
730-Day SEC Yield A fund's 30-Day SEC Yield is a calculation based on the 30 days ending on the last day of the previous month. The yield figure reflects the dividends and interest earned during the period, after the deduction of the fund's expenses.
8Wtd. Average Maturity The average time it takes for securities in a portfolio to mature, weighted in proportion to the dollar amount that is invested in the portfolio. Weighted average maturity measures the sensitivity of fixed-income portfolios to interest rate changes.
9Net Yield to Worst at NAV is the yield to expected payout of principal given current market pricing, net of current management fees.
10Duration to Worst is a measure of weighted average expected cash flows based on expected maturity of bonds. This measure can indicate interest rate sensitivity as a higher duration to worst indicates greater sensitivity to moves in interest rates and a lower duration to worst indicates relatively lower sensitivity to a move in interest rates.
11Sales Charge: Shares of the Mairs & Power Minnesota Municipal Bond ETF can be purchased through financial advisors or are available through online brokerage firms. These firms may charge commissions and sales charges.